Checking The Check

A book by Justin Moldenhauer

Big Organic
Certifiably Sold

Organic started as a word one farmer used in 1940 to describe food grown without synthetic chemistry. This book follows it from there, and asks one question the whole way: who's grading the test, and do they have a real reason to grade it honestly?
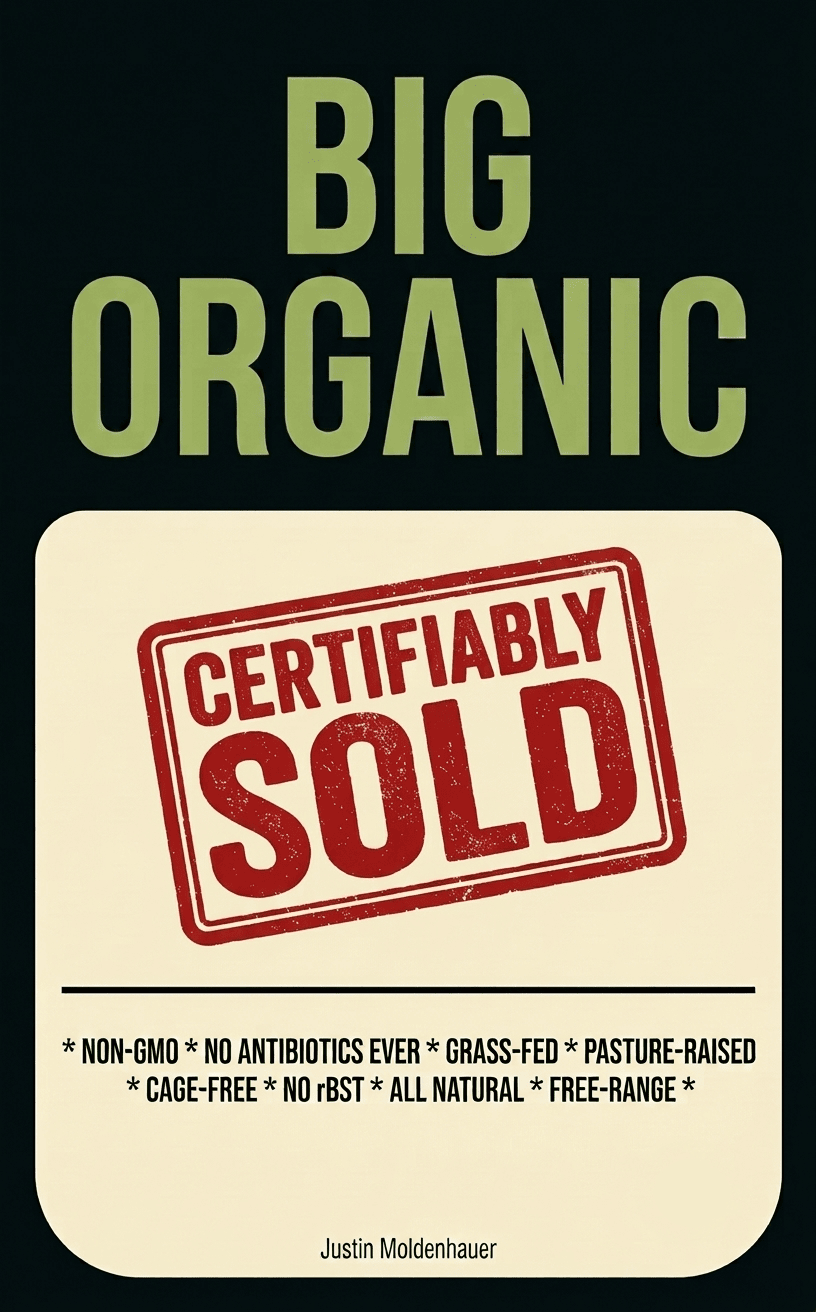
Cover of Big Organic: Certifiably Sold

Get it

Read it free, or take a copy

Tips welcome if you enjoyed it. Thank you. ☕ Buy me a coffee

Chapters76, plus sources and bibliography
EPUBPhones, tablets, e-readers, with all charts
PDFAbout 190 pages, with cover and charts
FinishedAutumn 2026

What it is

Receipts, not a verdict.

The book isn't here to tell you how to feel about organic. It shows where the word came from, what grew up around it, who gets paid to check it, and where the evidence says the pattern is headed. Both the believers and the skeptics get checked by the same standard.

Claims that aren't the author's own experience are sourced in the Sources section, organized by chapter, and the funding behind studies and watchdogs is disclosed where it matters.

From the book

The charts

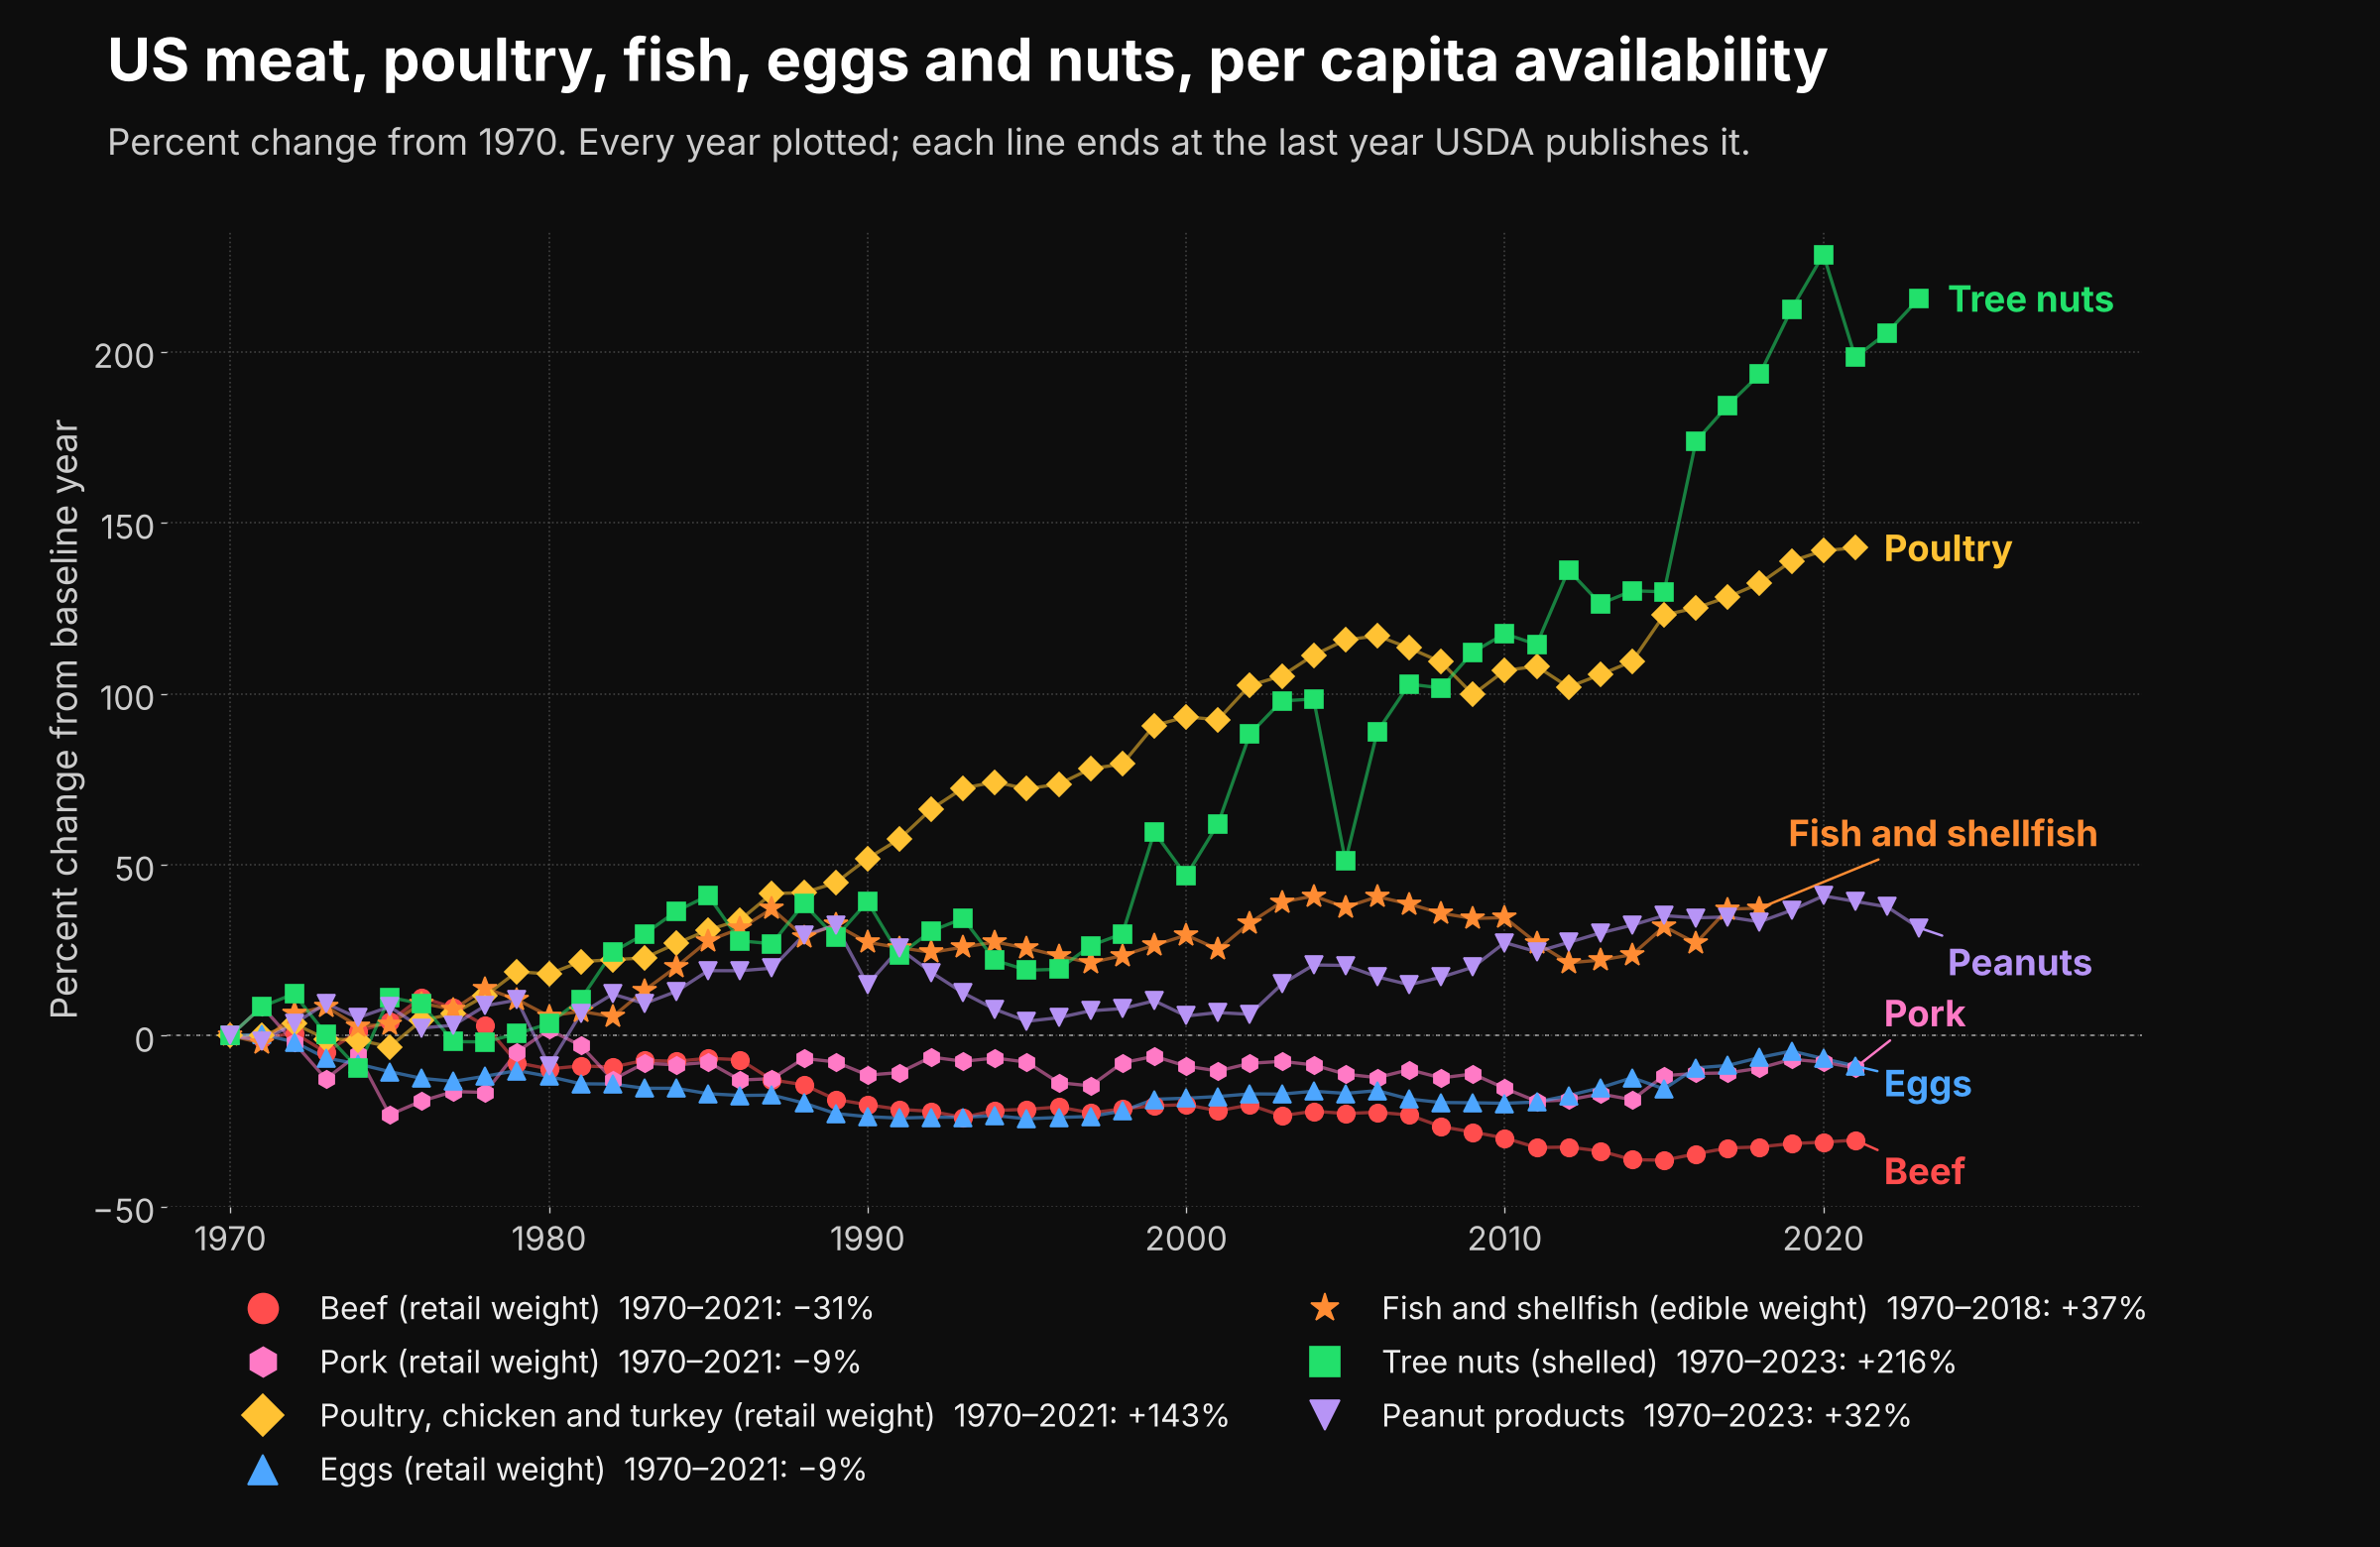
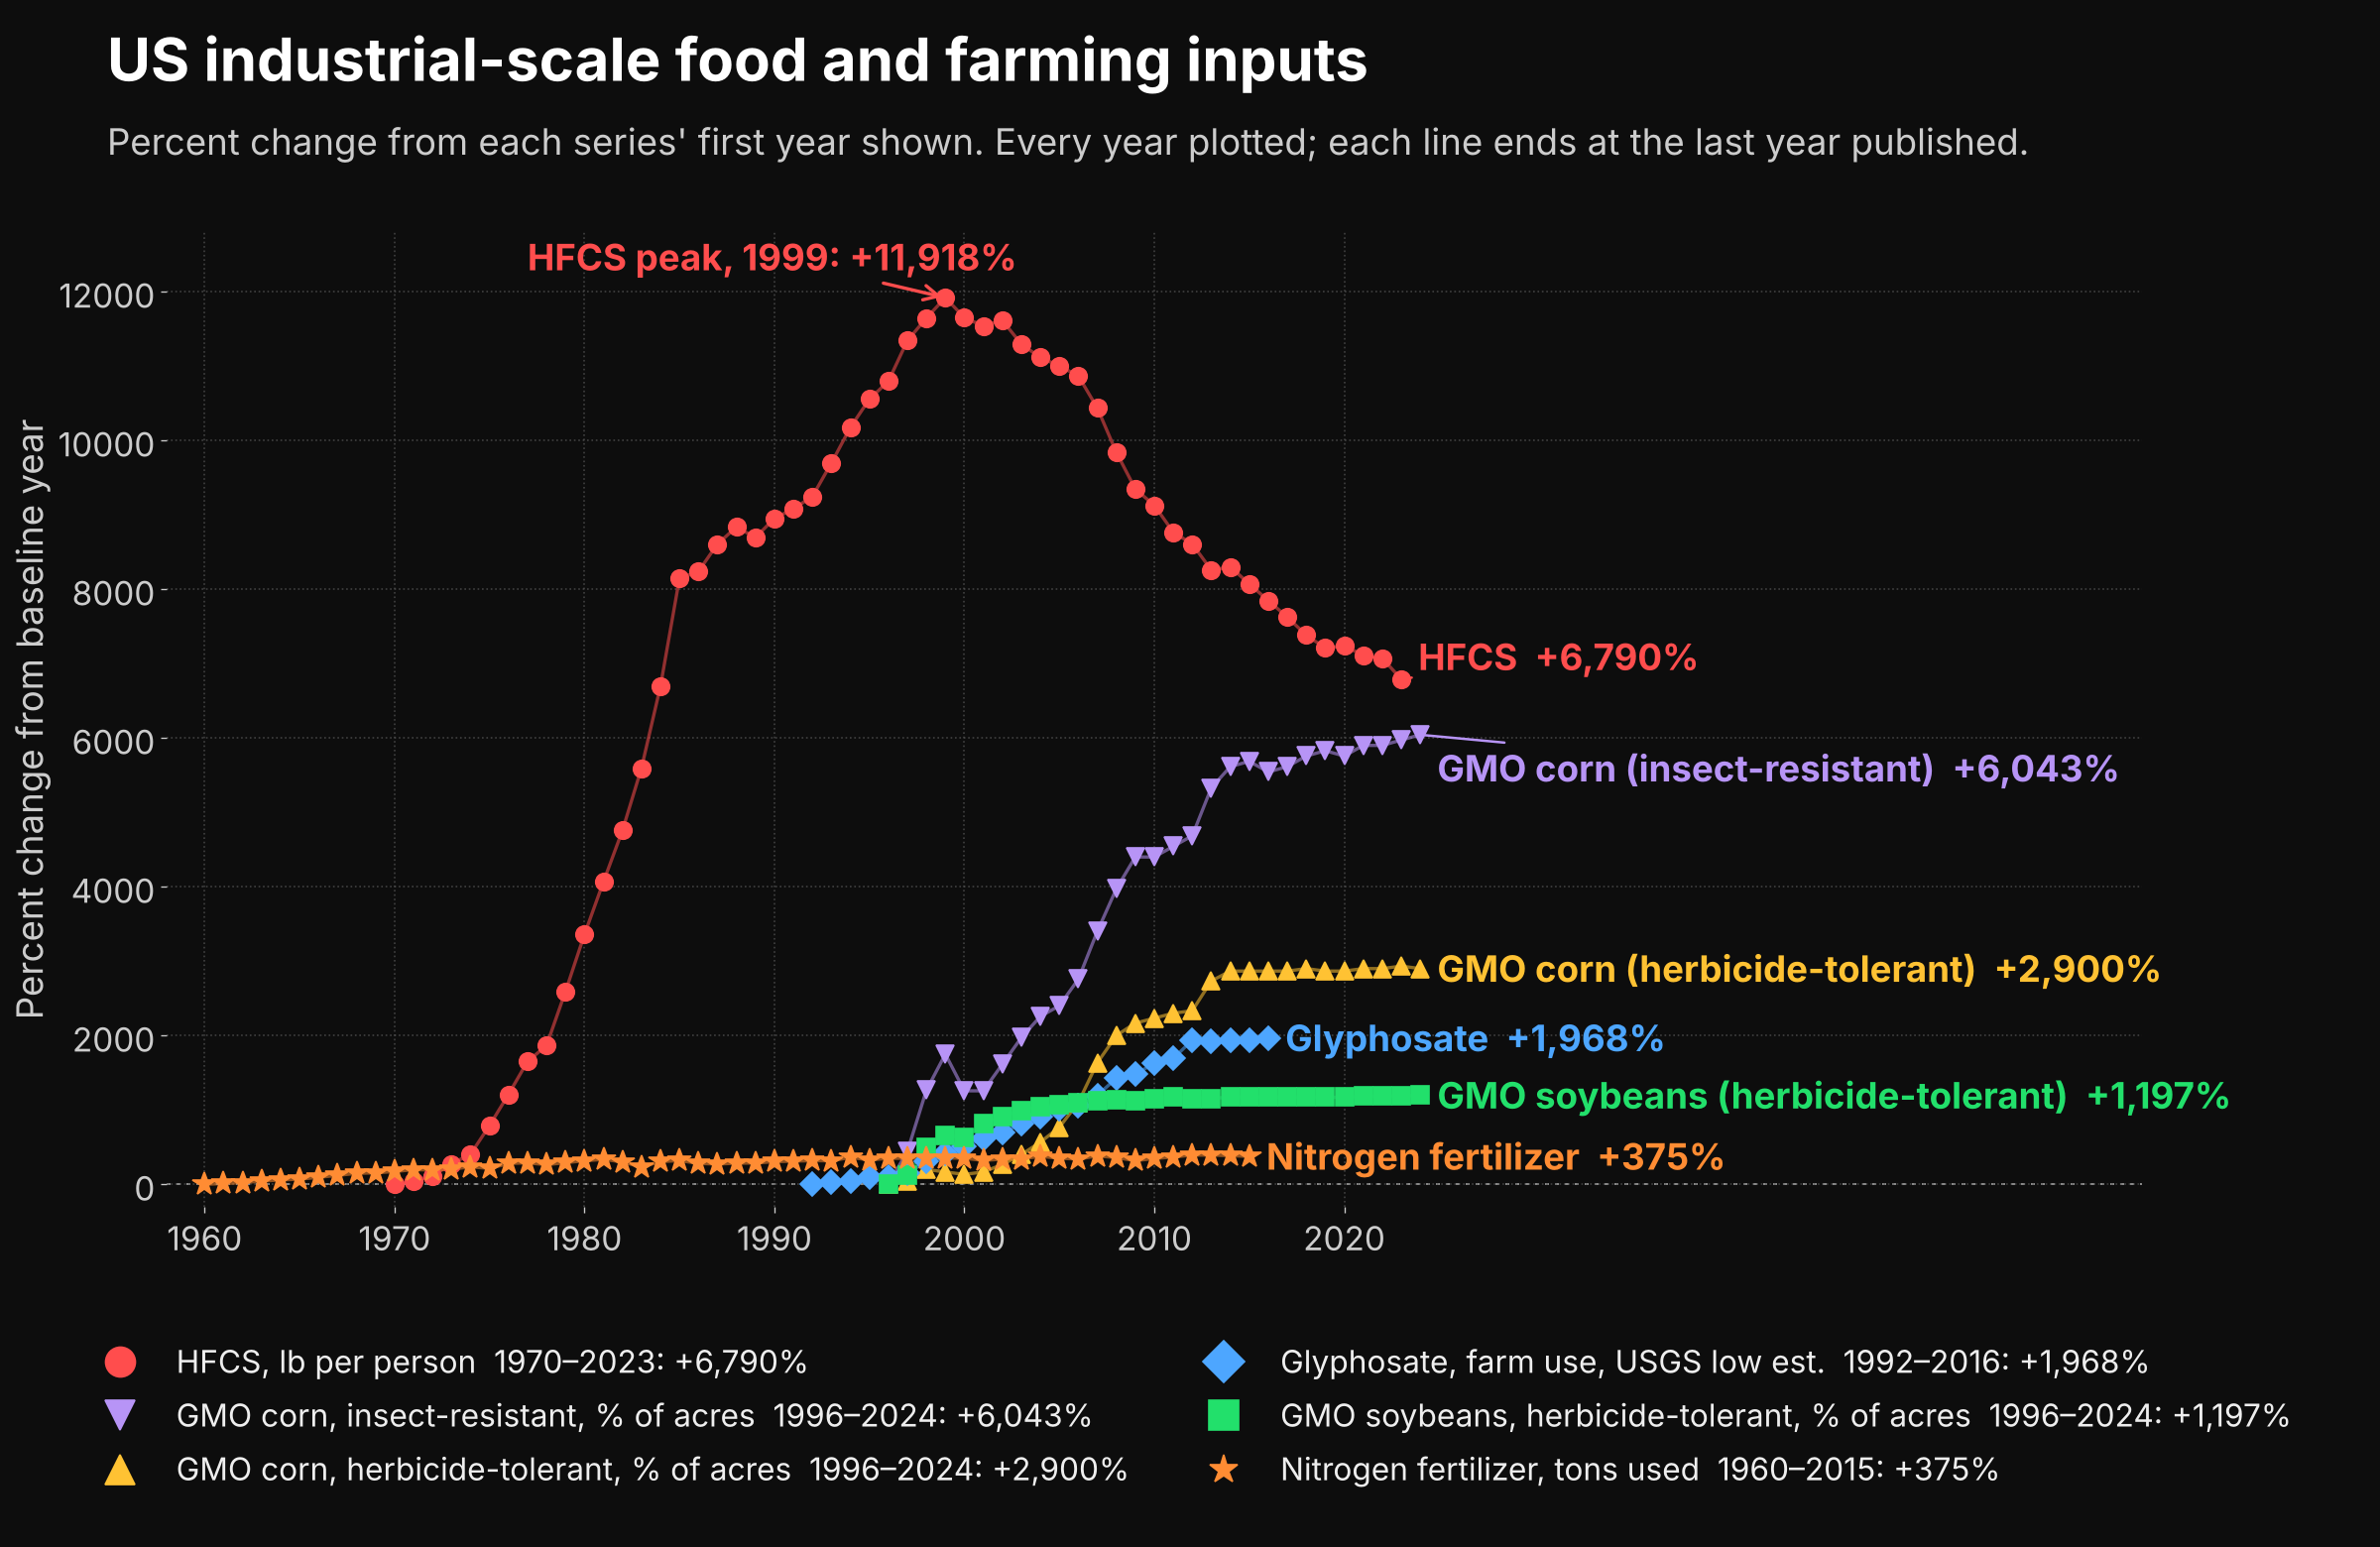
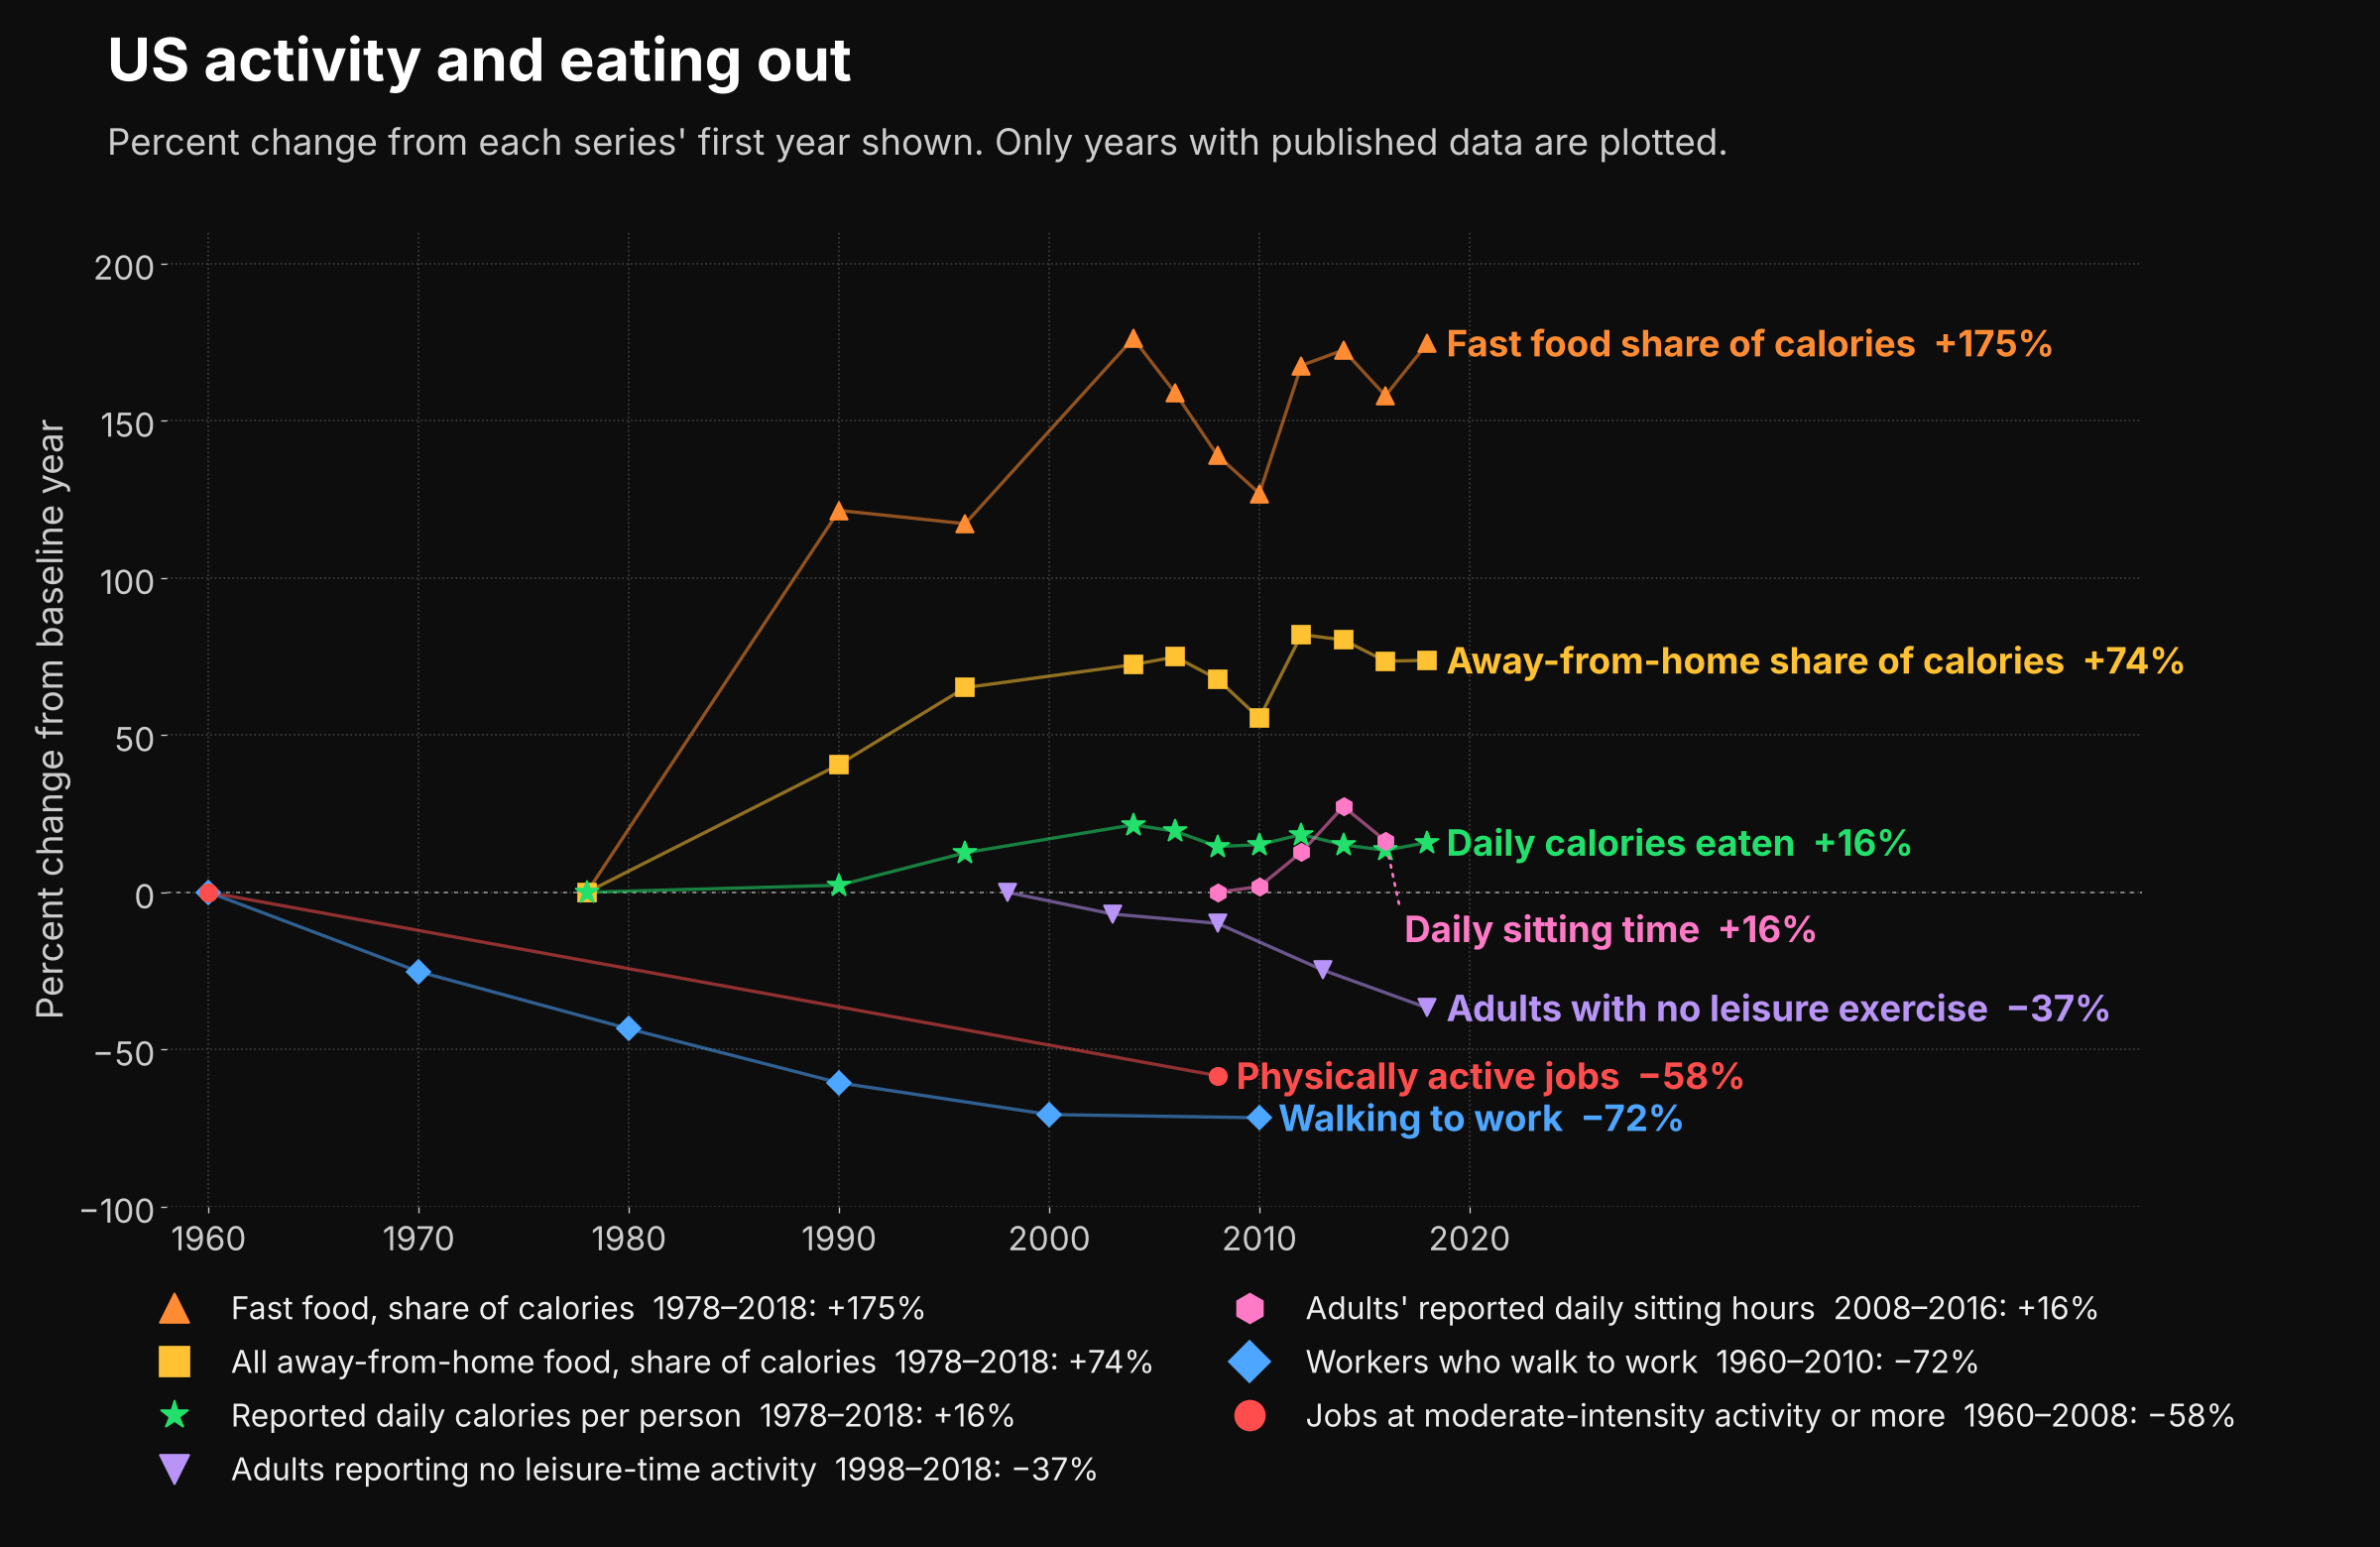
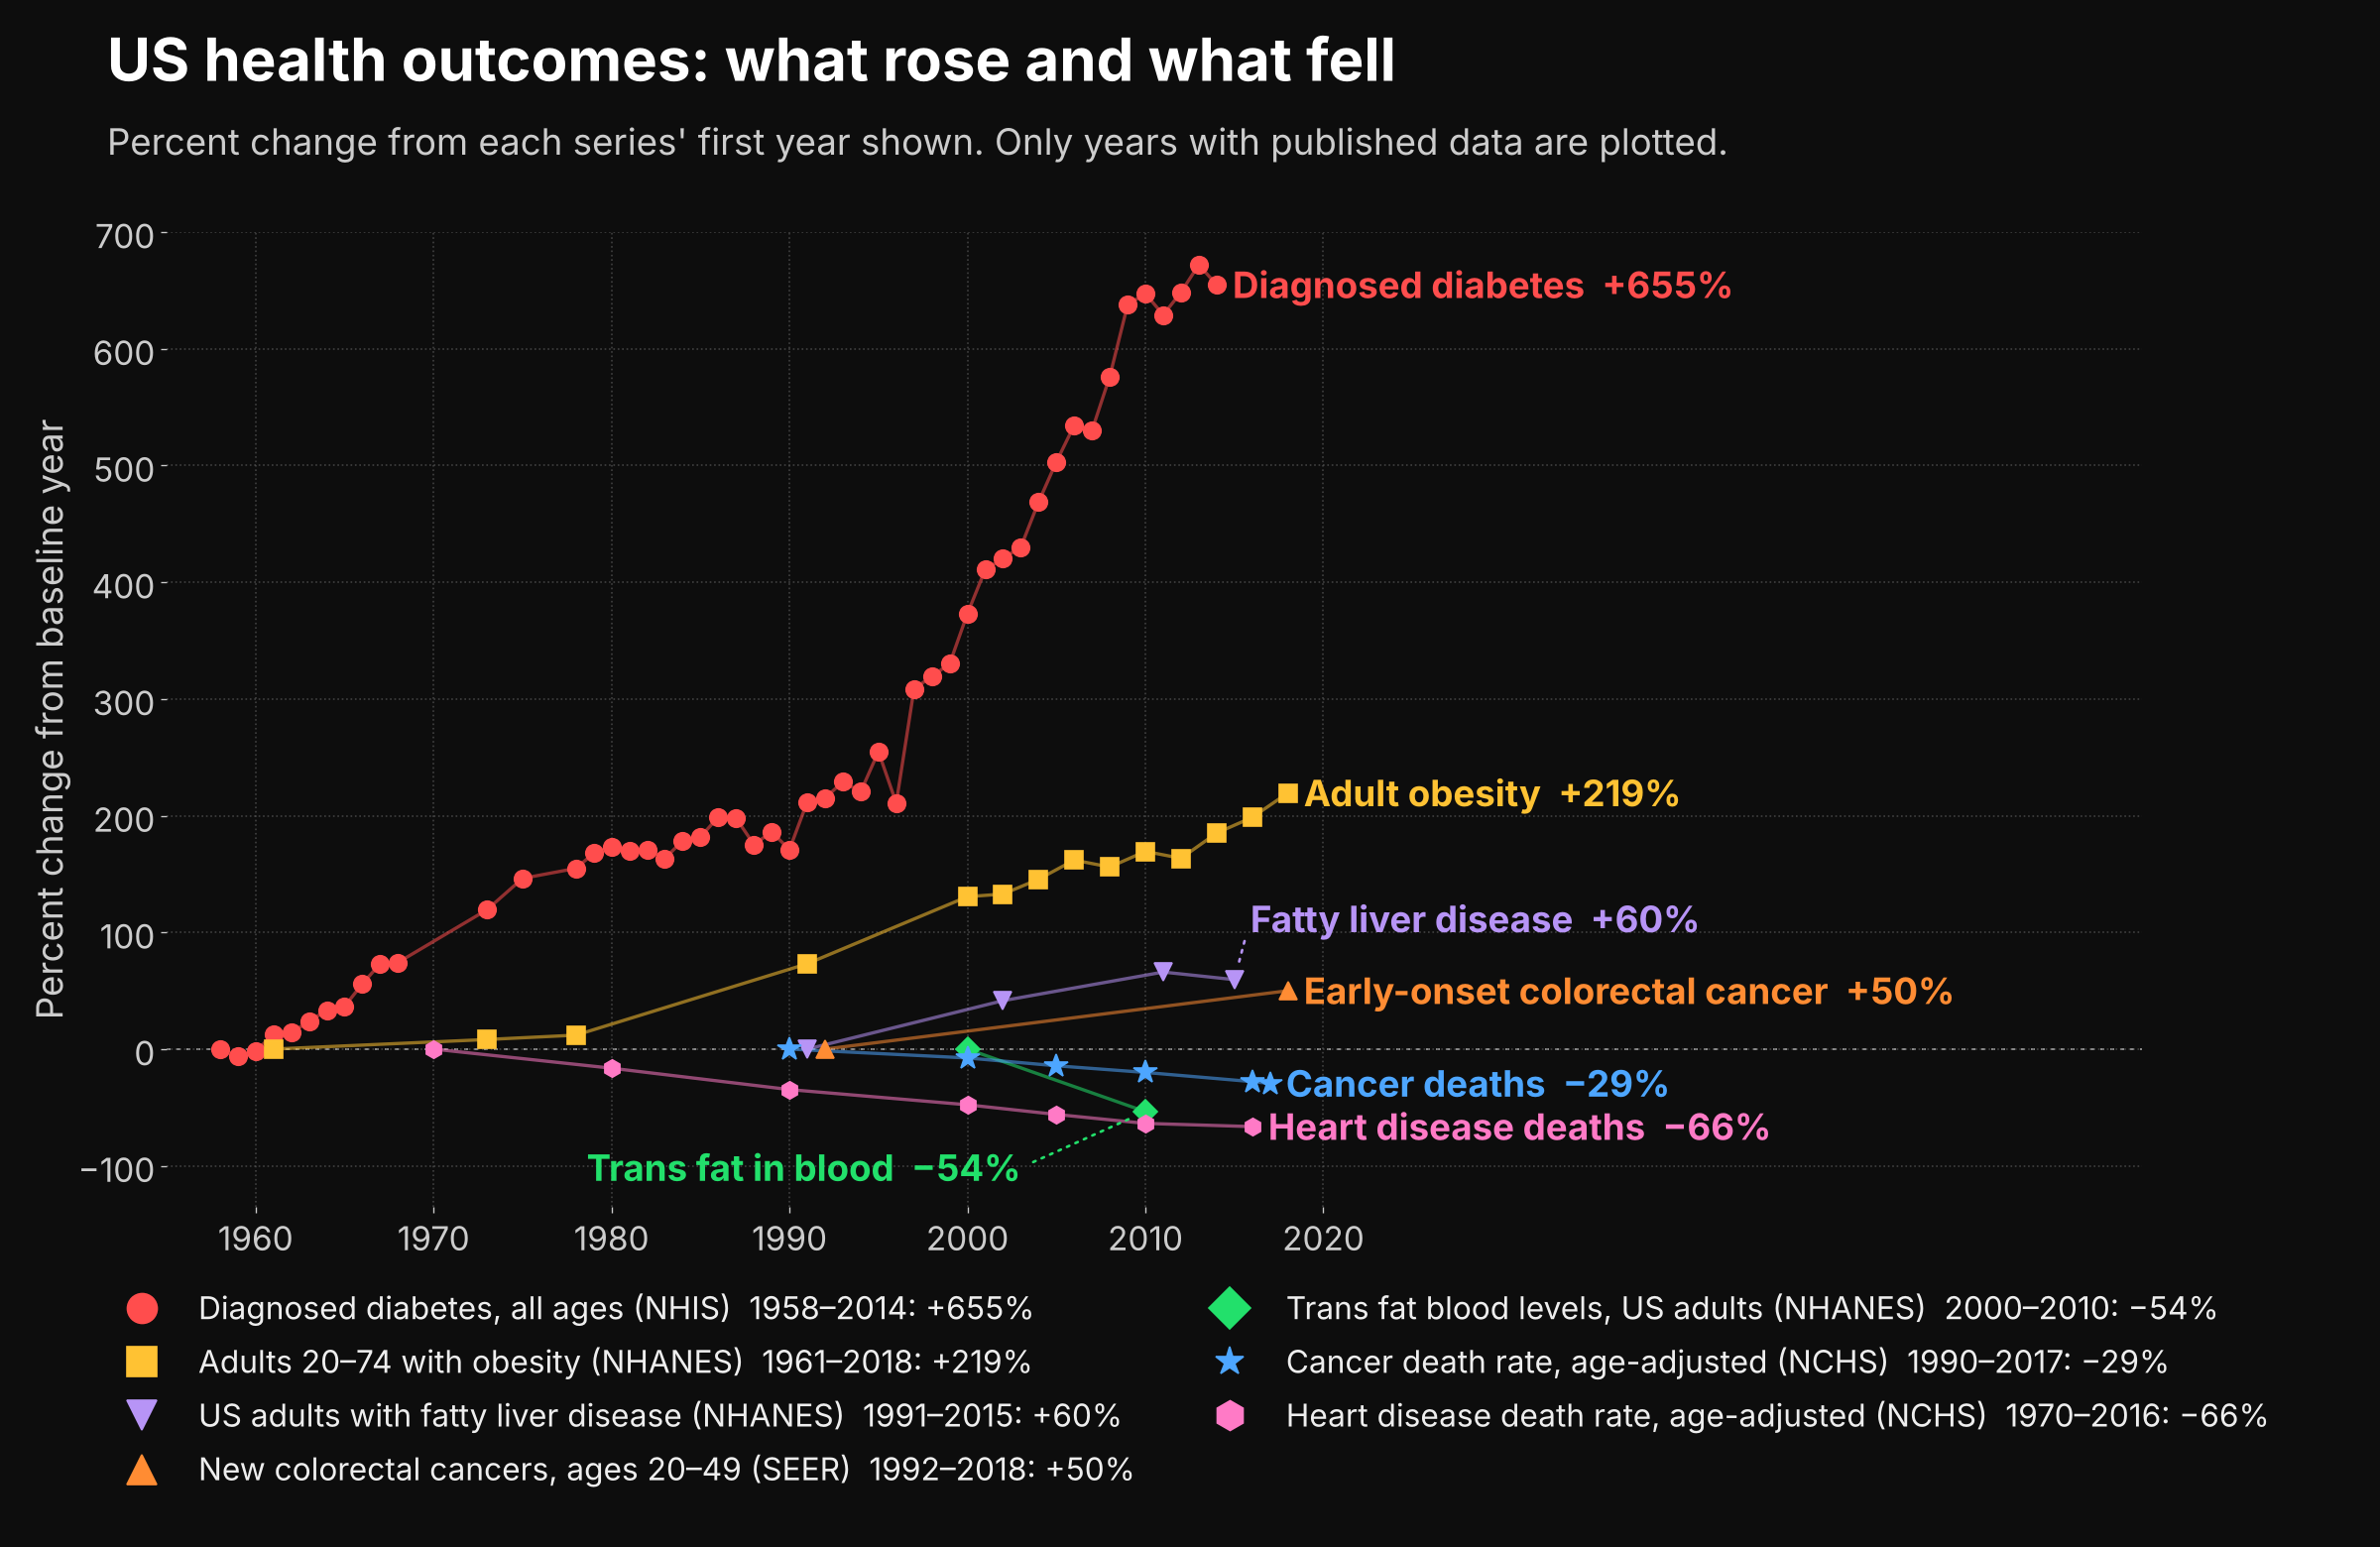
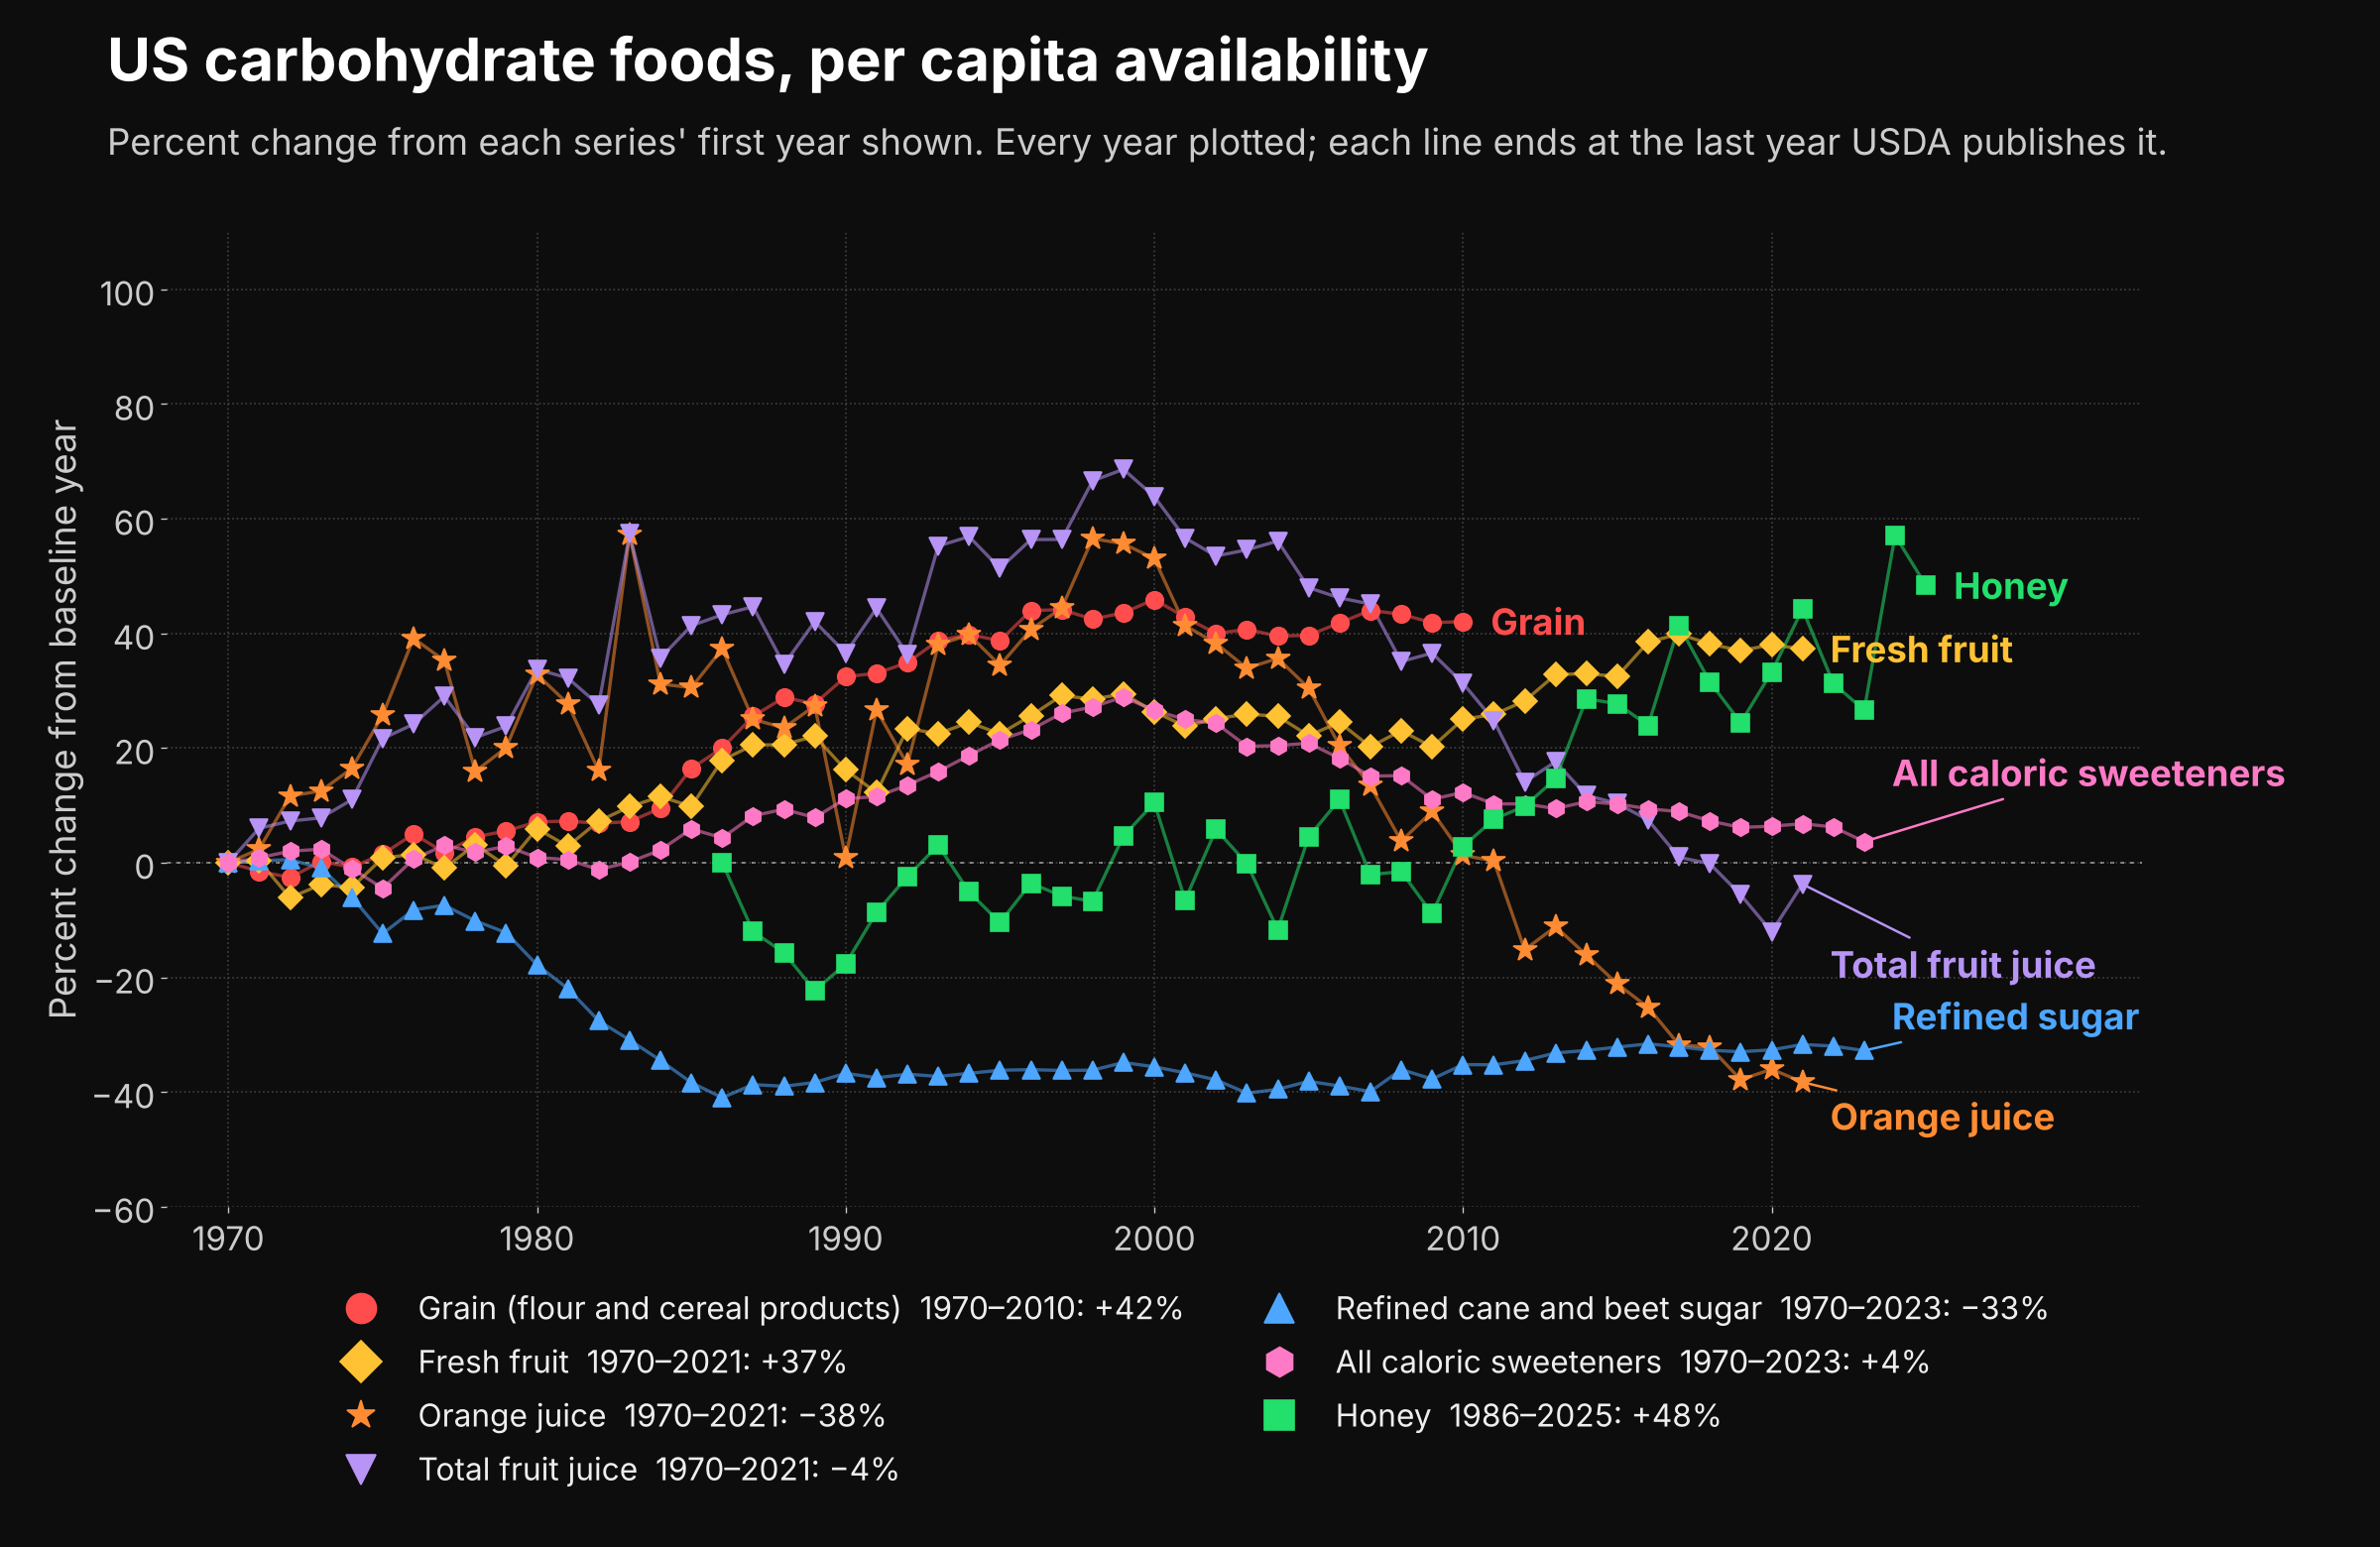
Every chart is built from public government data, each series measured against its own first year. Click one to see it full size.
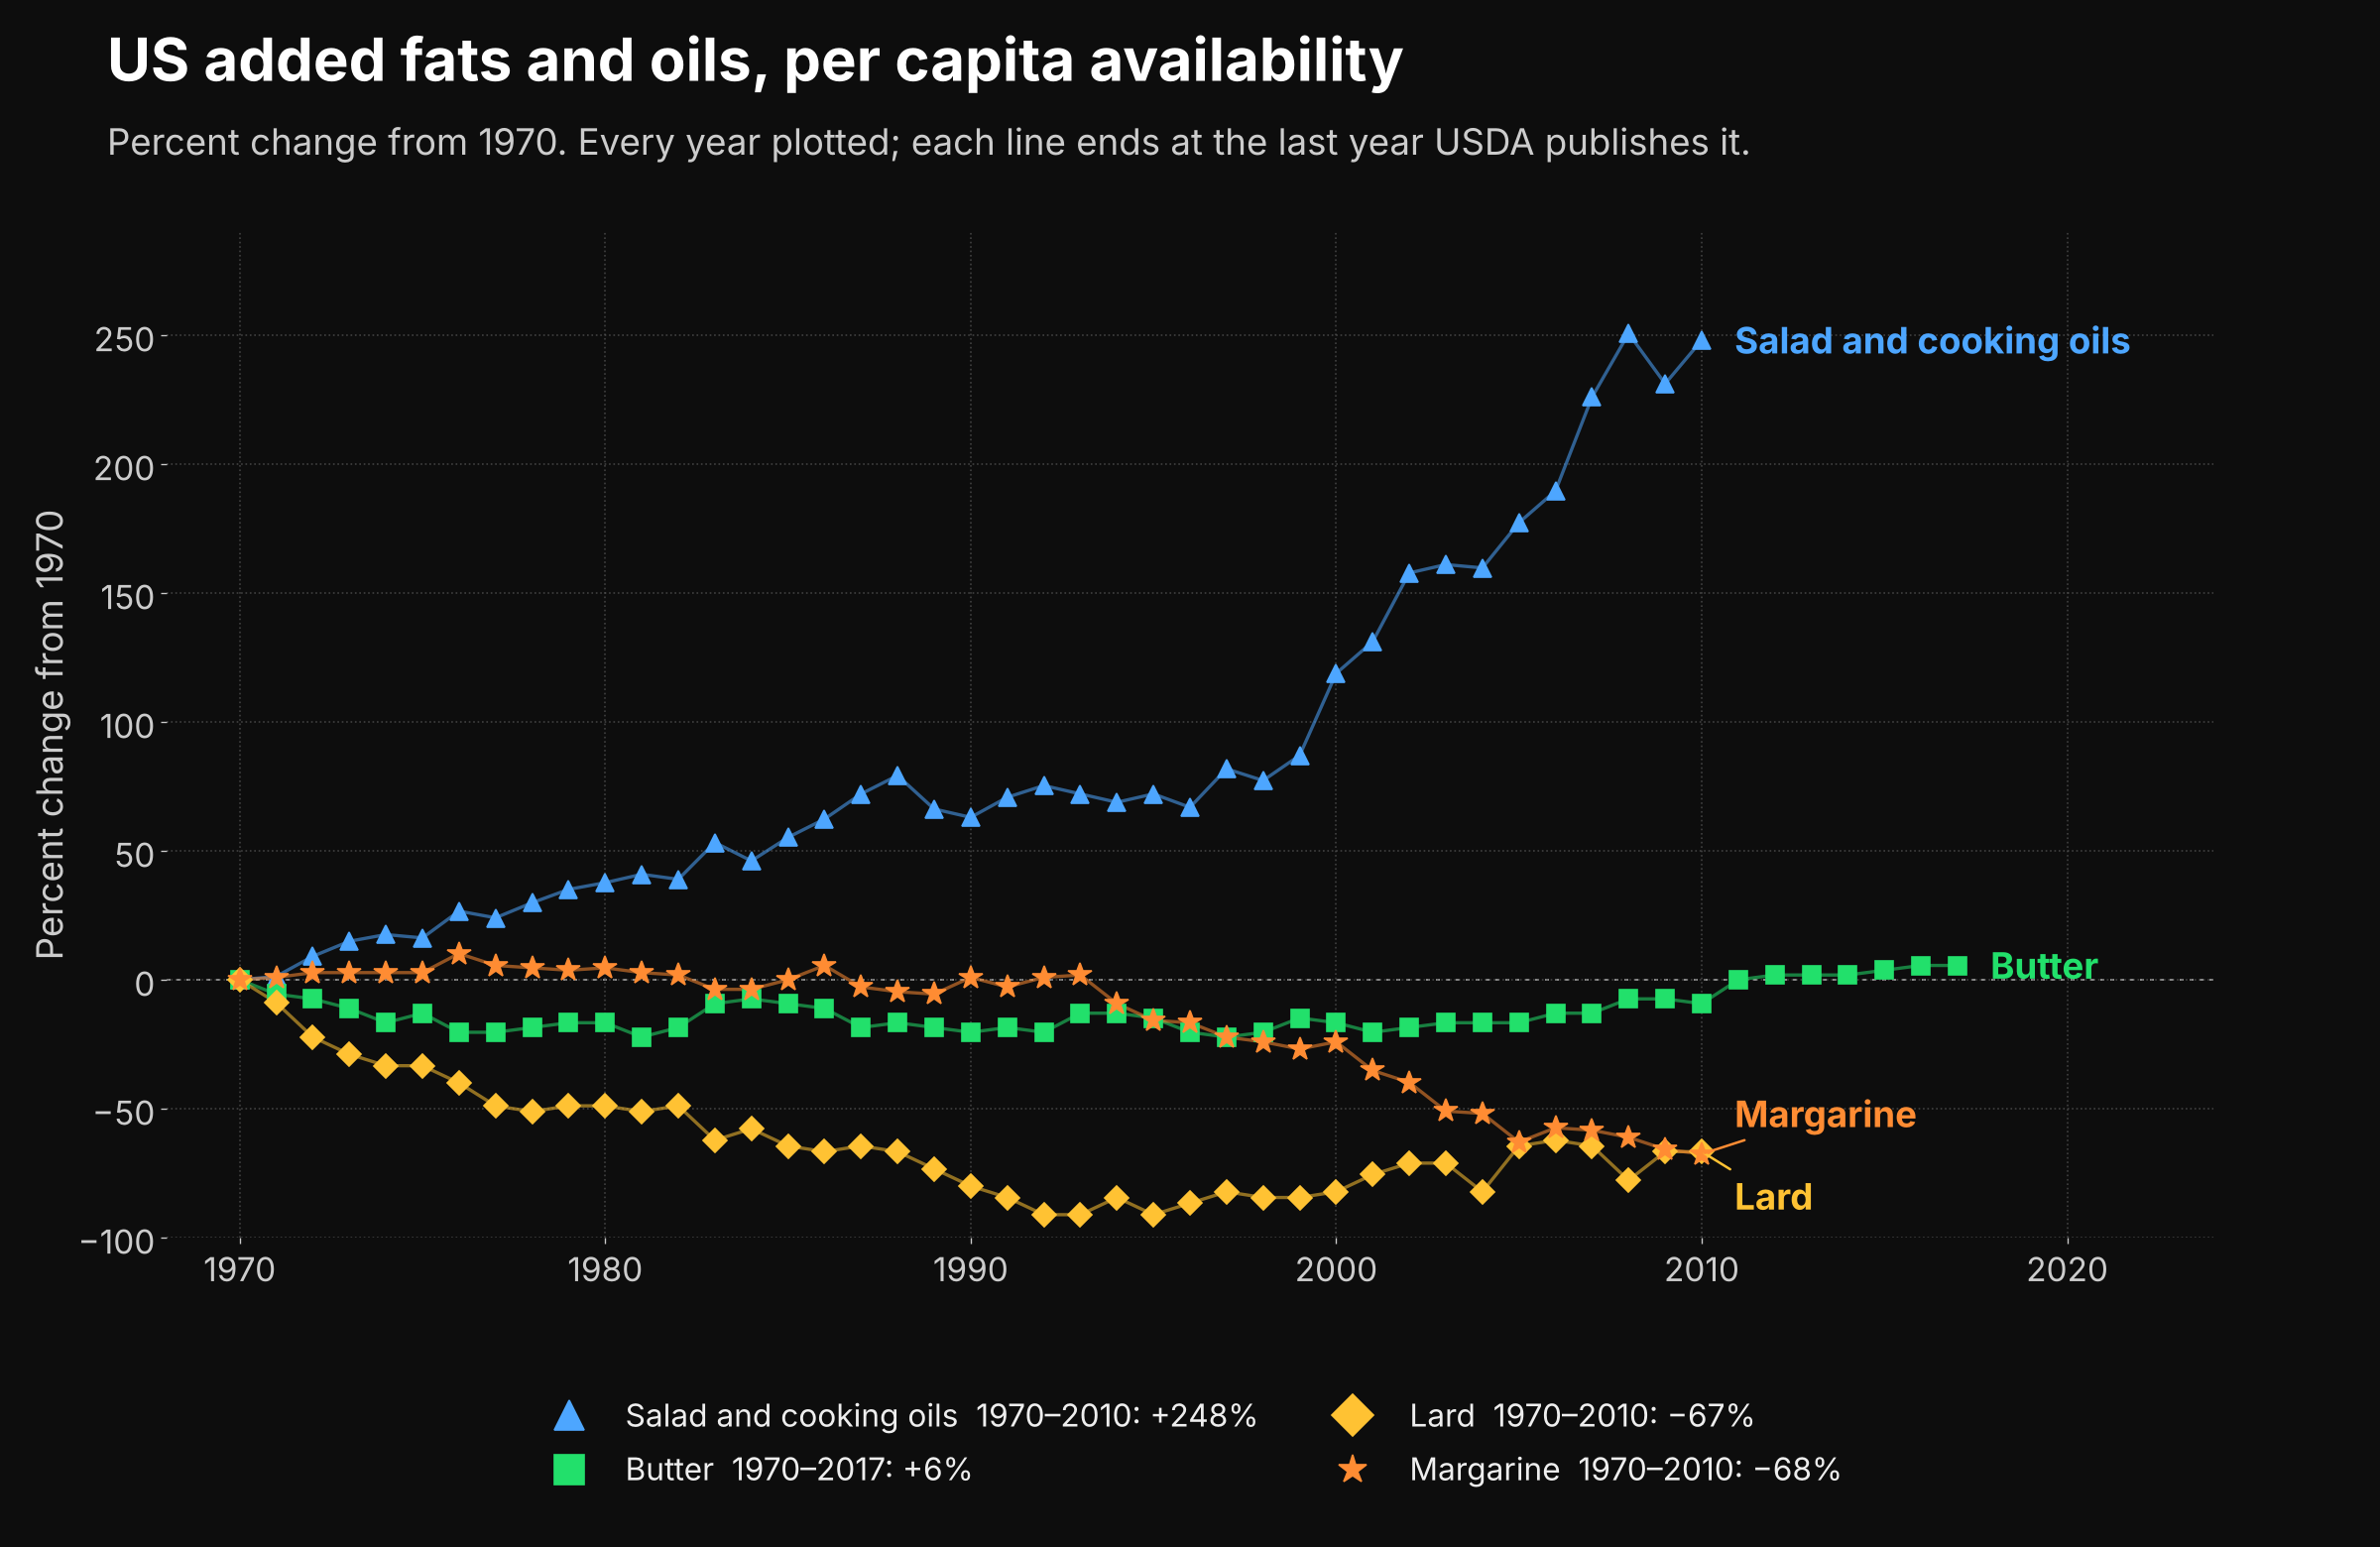
US added fats and oils, per capita availability, percent change from 1970
US carbohydrate foods, per capita availability, percent change from each series' first year shown
US meat, poultry, fish, eggs and nuts, per capita availability, percent change from 1970
US industrial-scale food and farming inputs, percent change from each series' first year shown
US activity and eating out, percent change from each series' first year shown
US health outcomes: what rose and what fell, percent change from each series' first year shown
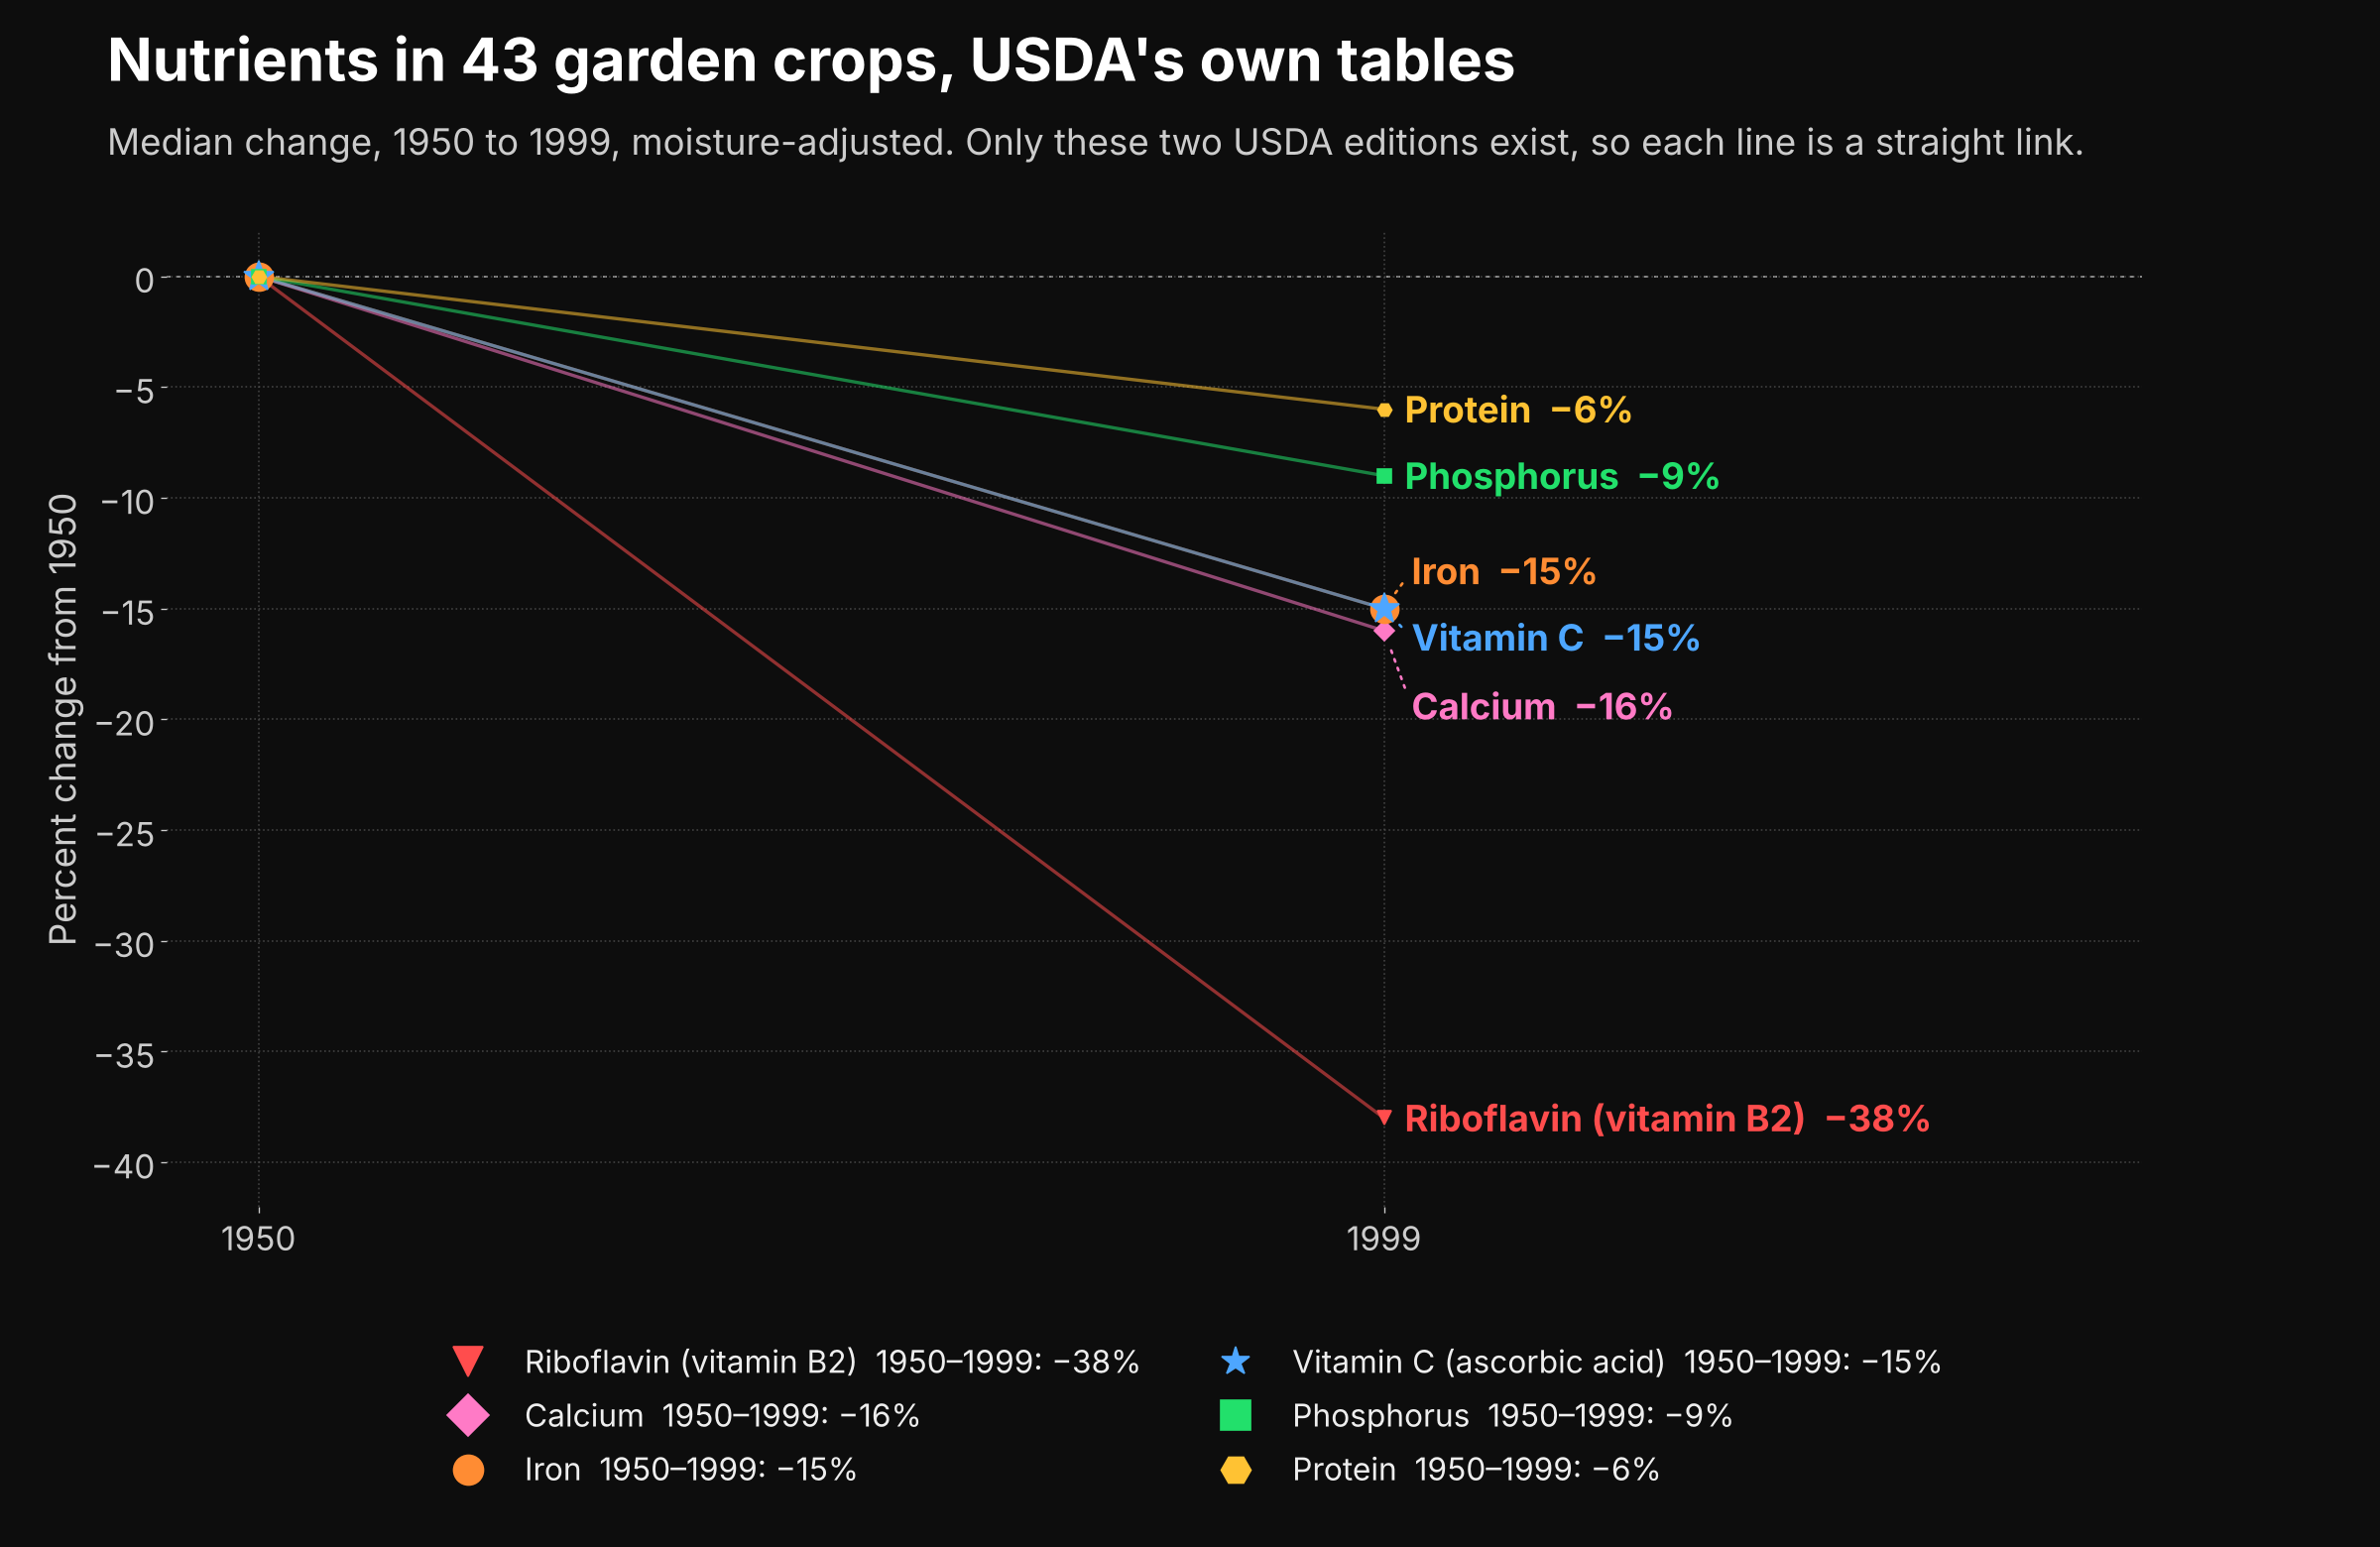
Median change in six nutrients across 43 garden crops, USDA tables 1950 to 1999
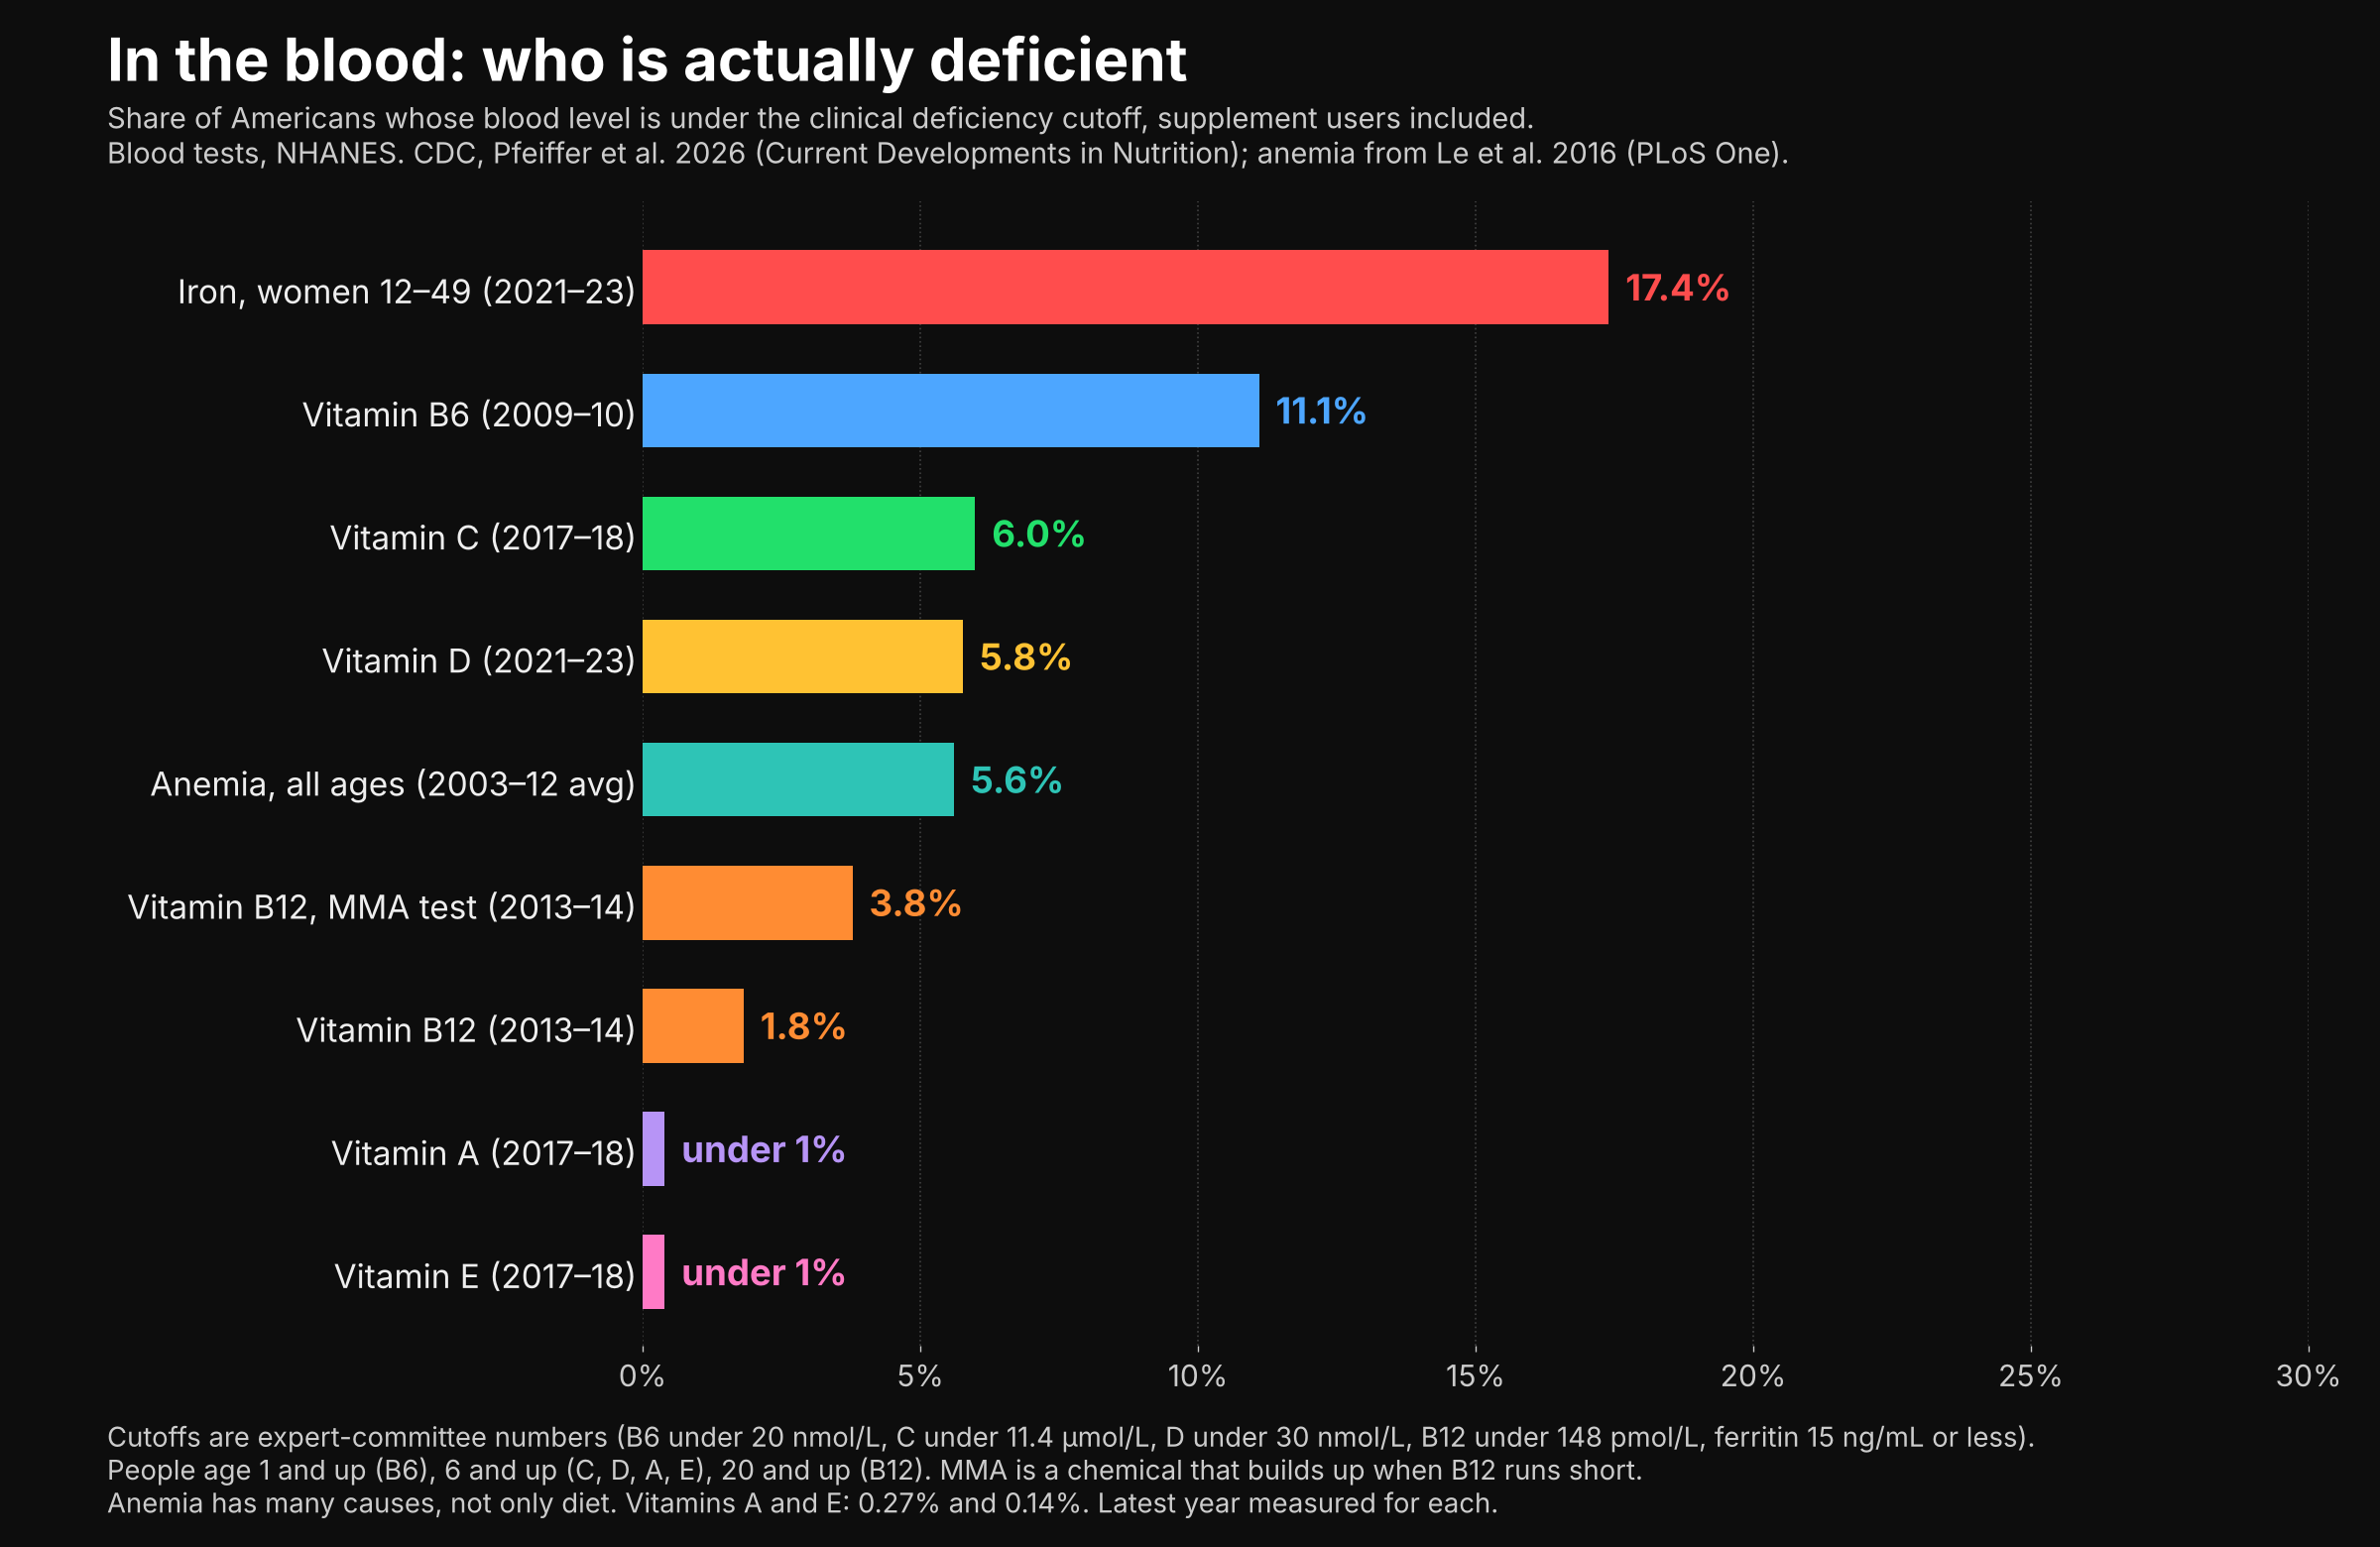
Share of Americans below the clinical deficiency cutoff by blood test, latest year measured: CDC 2026 nutrition report and Le 2016, not a timeline
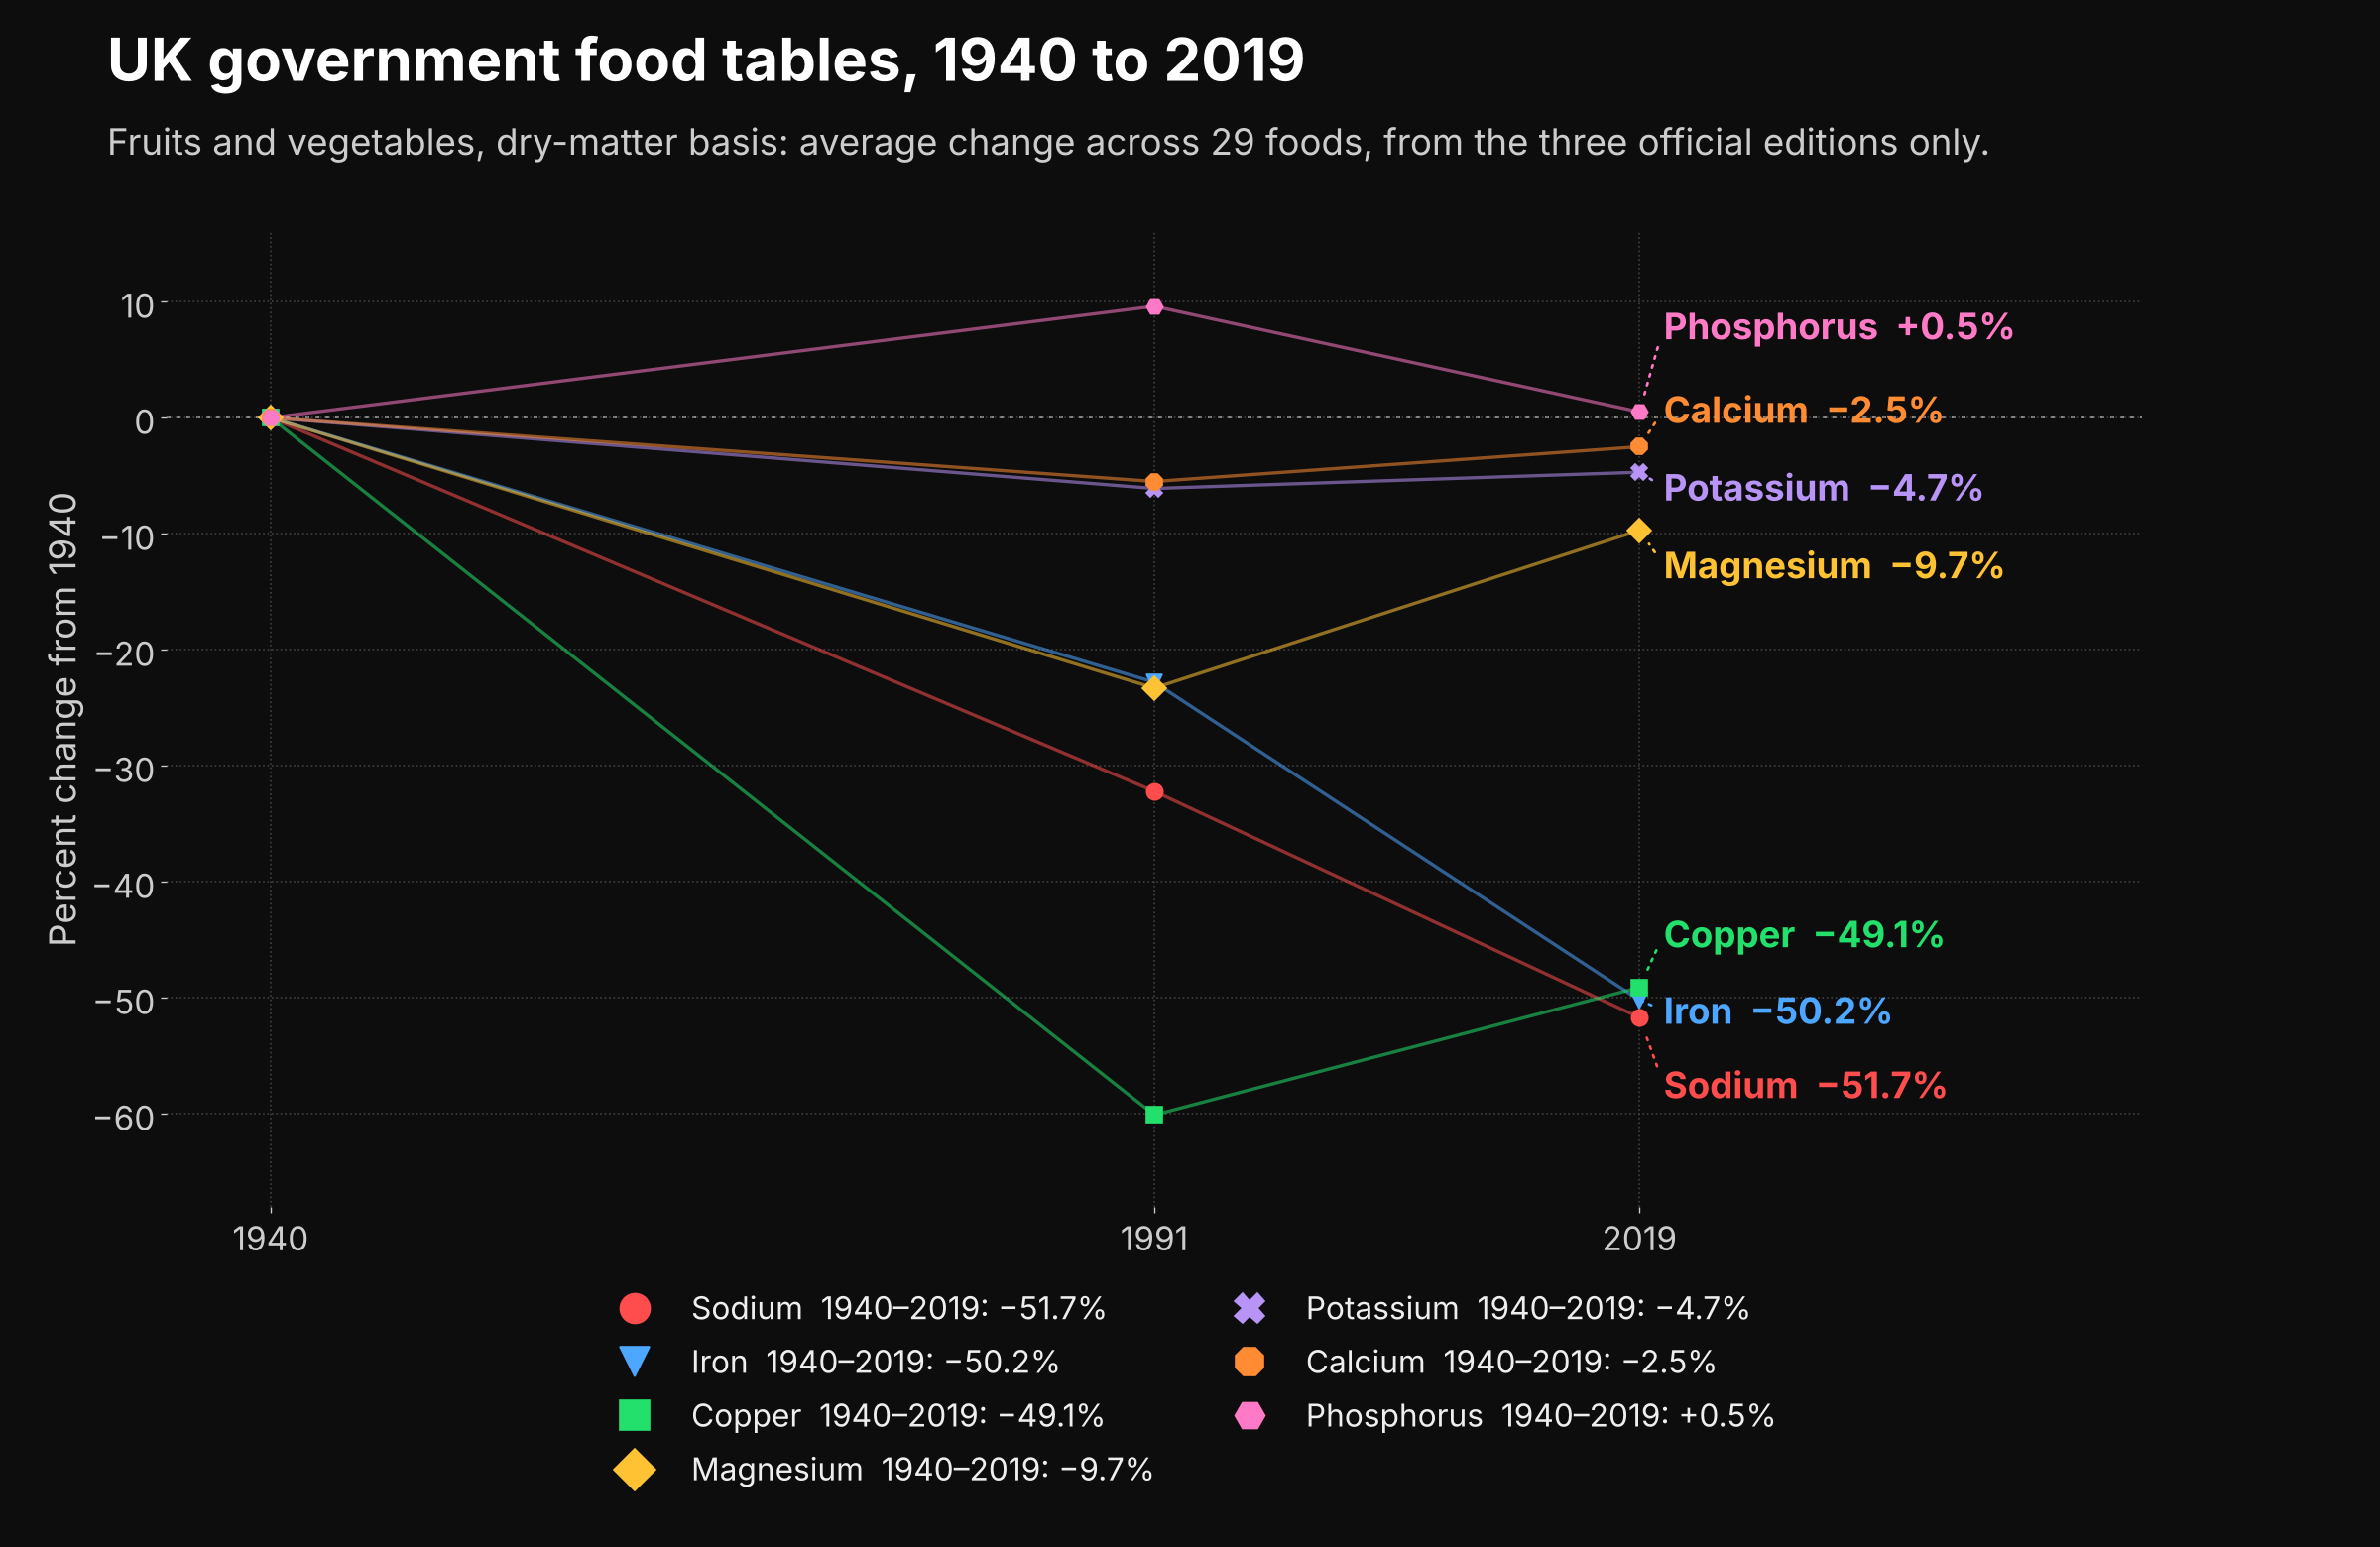
UK government food tables, 1940, 1991 and 2019: average change in seven minerals across 29 fruits and vegetables